Example usage of vPoller
This page provides some examples how vPoller can be used to perform various operations like discovery and polling of VMware vSphere objects.
Please also refer to the Supported methods by vPoller documentation for the full list of supported vPoller methods you could use.
The property names which we use in these examples can be found in the official VMware vSphere API documentation.
Each vSphere managed object has specific properties, which are documented in the official documentation.
The examples here serve for demonstration purpose only and do not provide all the properties you could use and get from vSphere objects, so make sure to refer to the official vSphere documentation when looking for a specific property name.
There are also a number of posts about how vPoller is being used for various purposes, which you could also read at the following links:
- VMware vSphere CLI tips & tricks with vPoller
- VMware monitoring with Zabbix, Python & vPoller
- Exporting Data From a VMware vSphere Environment For Fun And Profit
Getting vSphere “about” info
Using the about vPoller method you can retrieve information about
your vSphere host such as API version, vendor, build number, etc.
Here is an example of using the vPoller about method:
$ vpoller-client --method about --vsphere-host vc01.example.org \
             --method about --properties version,fullName,apiVersion,vendor
Datacenter examples
Here is how to discover all Datacenter objects from your vSphere
environment:
$ vpoller-client --method datacenter.discover --vsphere-host vc01.example.org
An example command that would get the summary.overallStatus
property of a specific Datacenter:
$ vpoller-client --method datacenter.get --vsphere-host vc01.example.org \
             --name datacenter01 --properties name,overallStatus
ClusterComputeResource examples
A ClusterComputeResource managed object is what you are used to
refer to simply as cluster in vSphere. The examples commands below
show how to discover and get properties for your vSphere clusters.
An example command to discover all ClusterComputeResource
managed objects from your vSphere environment:
$ vpoller-client --method cluster.discover --vsphere-host vc01.example.org
And here is how to get the overallStatus property for a specific
ClusterComputeResource managed object:
$ vpoller-client --method cluster.get --vsphere-host vc01.example.org \
             --name cluster01 --properties name,overallStatus
HostSystem examples
HostSystem managed objects in vSphere are your ESXi hosts.
Here is an example how to discover all your ESXi hosts from your vSphere environment:
$ vpoller-client --method host.discover --vsphere-host vc01.example.org
And here is an example command to get the runtime.powerState
property for a specific HostSystem object:
$ vpoller-client --method host.get --vsphere-host vc01.example.org \
             --name esxi01.example.org --properties runtime.powerState
An example command to get all Virtual Machines registered on a specific ESXi host:
$ vpoller-client --method host.vm.get --vsphere-host vc01.example.org \
             --name esxi01.example.org
Here is how you can get all datastores used by a specific ESXi host:
$ vpoller-client --method host.datastore.get --vsphere-host vc01.example.org \
             --name esxi01.example.org
VirtualMachine examples
An example command to discover all VirtualMachine managed
objects from your vSphere environment:
$ vpoller-client --method vm.discover --vsphere-host vc01.example.org
Another example showing how to get the runtime.powerState
property of a Virtual Machine:
$ vpoller-client --method vm.get --vsphere-host vc01.example.org \
             --name vm01.example.org --properties runtime.powerState
This is how you could discover all disks in a Virtual Machine. Note, that this method requires that you have VMware Tools installed and running on the target Virtual Machine:
$ vpoller-client --method vm.disk.discover --vsphere-host vc01.example.org \
             --name vm01.example.org
If you want to get information about a disk in a Virtual Machine you
could use the vm.disk.get vPoller method. This is how to get the
freeSpace property for a Virtual Machine disk:
$ vpoller-client --method vm.disk.get --vsphere-host vc01.example.org \
             --name vm01.example.org --properties freeSpace --key /var
In order to find out the host on which a specific Virtual Machine is
running on you could use the vm.host.get vPoller method:
$ vpoller-client --method vm.host.get --vsphere-host vc01.example.org \
             --name vm01.example.org
The example below shows how to retrieve information about the network that a Virtual Machine is using along with information about it’s IP address and MAC address:
$ vpoller-client --method vm.guest.net.get --vsphere-host vc01.example.org \
             --name vm01.example.org --properties network,ipAddress,macAddress
If you want to see which datastores your Virtual Machine is using you
can use the vm.datastore.get vPoller method, e.g.:
$ vpoller-client --method vm.datastore.get --vsphere-host vc01.example.org \
             --name vm01.example.org
Using the vm.process.get vPoller method we can get a list of all
processes running in a Virtual Machine. Note, that we need to supply a
username and password when using the vm.process.get method, which
are used for authentication in the guest system.
$ vpoller-client --method vm.process.get --vsphere-host vc01.example.org \
             --name vm01.example.org --properties name,owner,pid,cmdLine \
             --guest-username root --guest-password p4ssw0rd
Note
The above example command uses the root user for authentication
in the guest system. It is recommended that you use a user
with restricted privileges when using the vm.process.get
vPoller method if security is a concern.
Datastore examples
Here is an example command which will discover all Datastore
managed objects from your vSphere environment:
$ vpoller-client --method datastore.discover --vsphere-host vc01.example.org
This example command below would return the summary.capacity
property for a specific Datastore object.
$ vpoller-client --method datastore.get --vsphere-host vc01.example.org \
             -name ds:///vmfs/volumes/5190e2a7-d2b7c58e-b1e2-90b11c29079d/ \
             --properties summary.capacity
This example command will give you all hosts, which are using a
specific Datastore.
$ vpoller-client --method datastore.host.get --vsphere-host vc01.example.org \
             --name ds:///vmfs/volumes/5190e2a7-d2b7c58e-b1e2-90b11c29079d/
Viewing established Sessions
vPoller can also be used for viewing the established sessions to your vSphere hosts.
Note
Viewing vSphere sessions by unauthorized parties may be considered as a security hole, as it may provide an attacker with information such as Session IDs, which could be used for spoofing a user’s session.
If security is a concern make sure that your vSphere Agents are
configured to use an account with restricted set of privileges,
which cannot view the established vSphere sessions.
Here is an example command that will return the established sessions for your vSphere host:
$ vpoller-client --method session.get --vsphere-host vc01.example.org
Getting vSphere Events
With vPoller you can also retrieve vSphere events.
This is how you can retrieve the last registered event from your vSphere host:
$ vpoller-client --method event.latest --vsphere-host vc01.example.org
Getting vSphere Alarms
Using the *.alarm.get vPoller methods we can retrieve the
triggered vSphere alarms on a Datacenter,
ClusterComputeResource, HostSystem, VirtualMachine and
Datastore level.
Here is how you could retrieve all triggered alarms for a Datacenter.
$ vpoller-client --method datacenter.alarm.get --vsphere-host vc01.example.org \
             --name MyDatacenter
An here is an example result from the above command, showing the triggered alarms for our Datacenter.
{
  "success": 0,
  "result": [
    {
      "overallStatus": "red",
      "time": "2015-02-13 09:16:50.916096+00:00",
      "key": "alarm-4.host-30",
      "entity": "esxi01.example.org",
      "acknowledged": false,
      "acknowledgedByUser": null,
      "info": "Host memory usage"
    }
  ],
  "msg": "Successfully retrieved alarms"
}
Performance metrics
Note
If you are running a vSphere 6.0 environment and experience issues with real-time performance metrics, make sure to check [KB-2119264](http://kb.vmware.com/kb/2119264) for more details.
Using vPoller you can retrieve various performance metrics from your VMware vSphere environment.
In the following examples we will see how we can use vPoller in order to discover the supported performance metrics in our vSphere environment and also how to retrieve real-time and historical statistics from different performance providers - ESXi hosts, Virtual Machines, Datastores, Clusters, etc.
For more information about the performance metrics in a VMware vSphere environment, please make sure to check the VMware vSphere API documentation and especially the PerformanceManager documentation where you can find information about the supported performance counters, the existing counter groups, description of each counter, etc.
First, let’s see how to obtain all performance counters that are
supported in our vSphere environment. Using the perf.metric.info
vPoller method we can retrieve a list of all supported performance
counters from our vSphere environment.
$ vpoller-client --method perf.metric.info --vsphere-host vc01.example.org
The result of the above command should contain all performance metrics
which are supported on the VMware vSphere host vc01.example.org.
Below is an example of a single counter as returned from the
perf.metric.info vPoller method.
{
   "perDeviceLevel": 3,
   "level": 1,
   "key": 143,
   "nameInfo": {
     "label": "Usage",
     "key": "usage",
     "summary": "Network utilization (combined transmit-rates and receive-rates) during the interval"
   },
   "groupInfo": {
     "label": "Network",
     "key": "net",
     "summary": "Network"
   },
   "unitInfo": {
     "label": "KBps",
     "key": "kiloBytesPerSecond",
     "summary": "Kilobytes per second"
   },
   "statsType": "rate",
   "rollupType": "average"
 }
You can find a sample file with all performance metrics as discovered on a VMware vSphere host in the perf-metric-info.json example file.
In order to obtain information about the supported performance metrics
for a specific performance provider (e.g. ESXi host, Virtual Machine,
Datastore, etc.) you can use the respective *.perf.metric.info
vPoller methods, e.g. vm.perf.metric.info, host.perf.metric.info,
etc.
The following example shows how to get the available performance metrics for a Virtual Machine:
$ vpoller-client --method vm.perf.metric.info --vsphere-host vc01.example.org \
             --name vm01.example.org
You can see an example result of using the vm.perf.metric.info
method in the vm-perf-metric-info.json example file, which shows the
available performance metrics for a specific Virtual Machine.
In the vm-perf-metric-info.json example file you will see
that each discovered performance metric has a counterId and
instance attribute, e.g.:
{
    "counterId": "net.usage.kiloBytesPerSecond.average",
    "instance": "vmnic0"
}
The counterId part from the above example counter is comprised of
the <groupInfo.key>.<nameInfo.key>.<unitInfo.key>.<rollupType>
attributes from our counter as discovered by the perf.metric.info
vPoller method.
We can also request specific counters only when using the
*.perf.metric.info methods. For example if we are only interested
in the net.usage.kiloBytesPerSecond.average counter, then we would
execute this command instead, which would return all counters and
their instances for our performance provider:
$ vpoller-client --method vm.perf.metric.info --vsphere-host vc01.example.org \
             --name vm01.example.org --counter net.usage.kiloBytesPerSecond.average
And here’s an example result after executing the above command.
{
  "result": [
    {
      "counterId": "net.usage.kiloBytesPerSecond.average",
      "instance": "4000"
    },
    {
      "counterId": "net.usage.kiloBytesPerSecond.average",
      "instance": "vmnic0"
    },
    {
      "counterId": "net.usage.kiloBytesPerSecond.average",
      "instance": "vmnic1"
    },
    {
      "counterId": "net.usage.kiloBytesPerSecond.average",
     "instance": ""
    }
  ],
  "msg": "Successfully retrieved performance metrics",
  "success": 0
}
We can also get the existing historical performance intervals by
using the perf.interval.info vPoller method, e.g.:
$ vpoller-client --method perf.interval.info --vsphere-host vc01.example.org
On the screenshot below you can see an example of retrieving the historical performance intervals on a vSphere host.
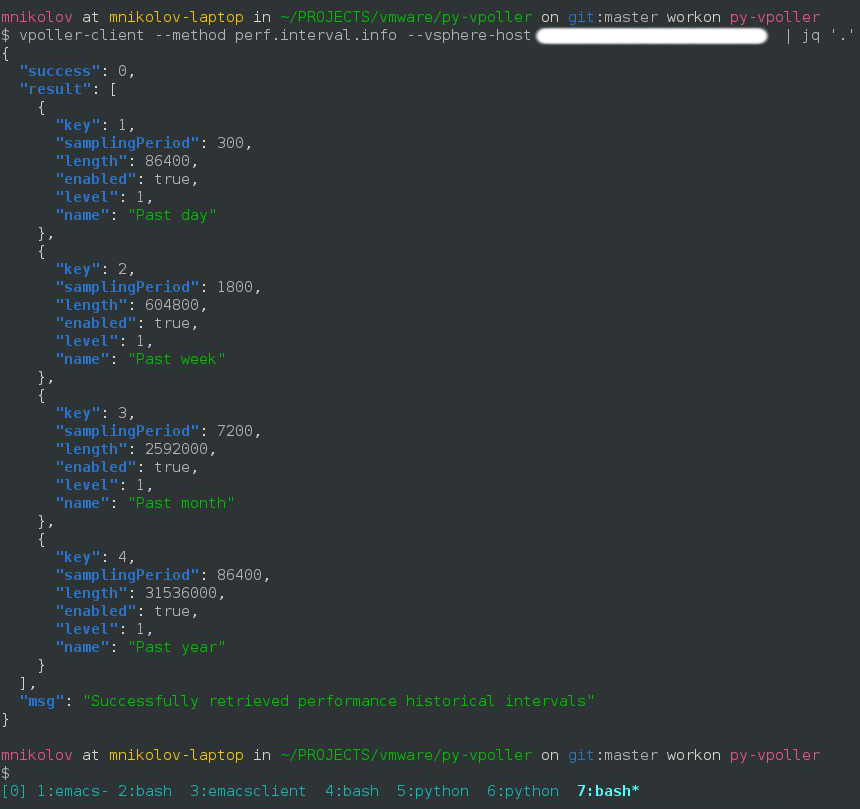
The historical performance intervals are used when we need to retrieve historical metrics from performance providers.
Now, that we know how to get the available performance metrics for our performance providers, let’s now see how to retrieve the actual performance counters for them.
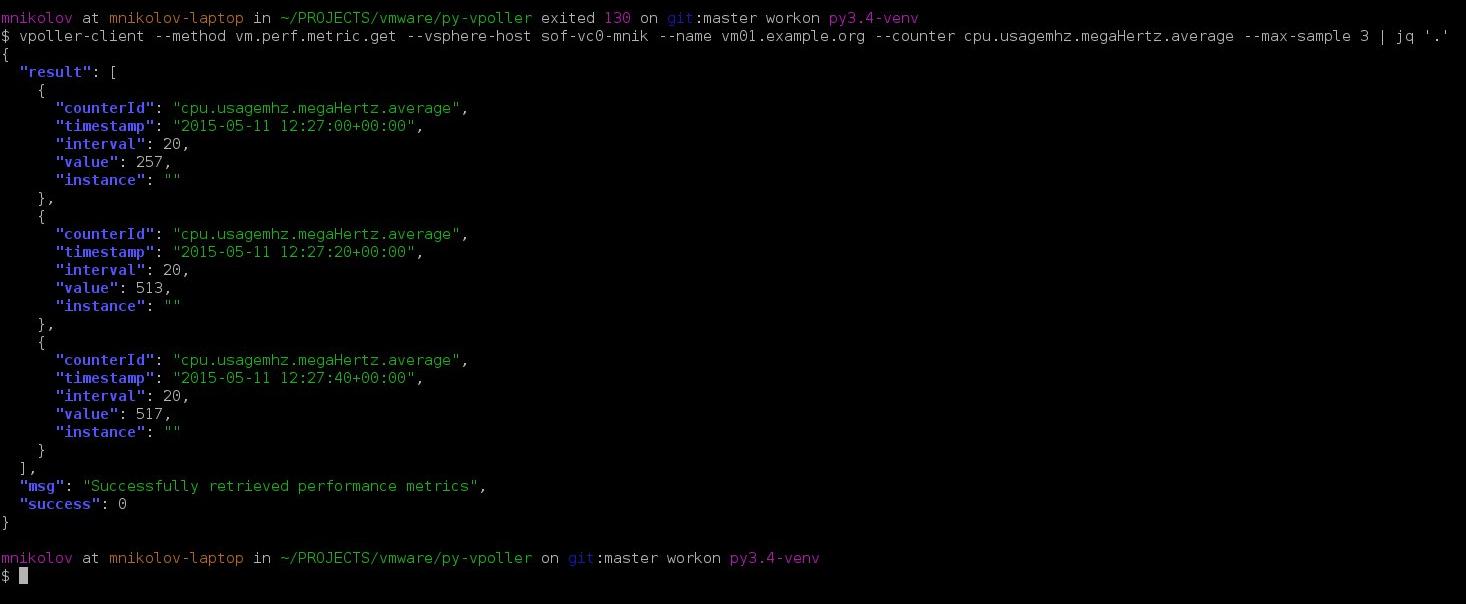
In the following example we will see how to get the CPU usage in MHz for a specific Virtual Machine.
And here is how we would get three samples of the CPU usage in MHz
performance metric.
$ vpoller-client --method vm.perf.metric.get --vsphere-host vc01.example.org \
             --name vm01.example.org --max-sample 3 --counter cpu.usagemhz.megaHertz.average
Here is an example result of the above command.
We can also retrieve the performance metrics for an instance, e.g. get the CPU usage per core.
If we want to retrieve the performance metrics for a specific instance we would execute a similar command instead:
$ vpoller-client --method vm.perf.metric.get --vsphere-host vc01.example.org \
             --name vm01.example.org --counter cpu.usagemhz.megaHertz.average --max-sample 3 --instance 0
We could also retrieve some interesting statistics from our Datacenters and Clusters as well.
The vim.Datacenter and vim.ClusterComputeResource
managed entities support historical statistics only, so in order to
retrieve any performance metrics from them we should specify a valid
historical performance interval.
In the following examples we will see how to retrieve performance
counter vmop.numPoweron.number.latest, which would give us the
number of the Virtual Machine power on operations for the past day.
$ vpoller-client --method datacenter.perf.metric.get --vsphere-host vc01.example.org \
             --name MyDatacenter --counter vmop.numPoweron.number.latest --perf-interval "Past day"
Another example showing how to get performance counter
mem.consumed.kiloBytes.average, which returns the amount of host
physical memory consumed by a virtual machine, host, or cluster.
$ vpoller-client --method host.perf.metric.get --vsphere-host vc01.example.org \
            --name esxi01.example.org --counter mem.consumed.kiloBytes.average
As our last examples we will see how to retrieve various performance
metrics for vim.Datastore managed entities.
Note
Some of the vim.Datastore performance metrics are retrieved
by using the datastore.perf.metric.get vPoller method, while
others are available via the host.perf.metric.get, where a
datastore metric is retrieved by using the Datastore instance.
A vim.Datastore performance provider by itself provides only
historical performance statistics.
Most of the real-time statistics (e.g. datastoreIops) are
accessed via a vim.HostSystem performance provider.
The example below shows how to retrieve the datastoreIops for a
specific datastore.
First we will discover all instances of performance counter
datastore.datastoreIops.number.average for our example
ESXi host esxi01.example.org.
$ vpoller-client --method host.perf.metric.info --vsphere-host vc01.example.org \
      --name esx01.example.org --counter datastore.datastoreIops.number.average
Example result from the above command is shown below, which contains
all instances of counter datastore.datastoreIops.number.average.
 {
  "success": 0,
  "result": [
    {
      "counterId": "datastore.datastoreIops.number.average",
      "instance": "5481d059-dbd6de3d-2215-d8d385bf2110"
    },
    {
      "counterId": "datastore.datastoreIops.number.average",
      "instance": "5485af07-7326ddc0-6afc-d8d385bf2110"
    },
    {
      "counterId": "datastore.datastoreIops.number.average",
      "instance": "5485af4f-4dbf72e3-4980-d8d385bf2110"
    }
  ],
  "msg": "Successfully retrieved performance metrics"
}
If we are interested in finding out the Datastore name for the
5481d059-dbd6de3d-2215-d8d385bf2110 instance from the above
example result we could use the datastore.get vPoller method to
do so. For example:
$ vpoller-client --method datastore.get --vsphere-host vc01.example.org \
             --name ds:///vmfs/volumes/5481d059-dbd6de3d-2215-d8d385bf2110/ --properties name
And the result from the above command would give us the Datastore name.
{
 "success": 0,
 "result": [
   {
     "name": "datastore1",
     "info.url": "ds:///vmfs/volumes/5481d059-dbd6de3d-2215-d8d385bf2110/"
   }
 ],
 "msg": "Successfully retrieved object properties"
}
Now, let’s get back to the datastoreIops metric and retrieve it.
$ vpoller-client --method host.perf.metric.get --vsphere-host vc01.example.org \
             --name esxi01.example.org --counter datastore.datastoreIops.number.average --instance 5481d059-dbd6de3d-2215-d8d385bf2110
And here is an example result from the above command:
{
  "success": 0,
  "result": [
    {
      "instance": "5481d059-dbd6de3d-2215-d8d385bf2110",
      "value": 84,
      "interval": 20,
      "counterId": "datastore.datastoreIops.number.average",
      "timestamp": "2015-02-10 15:48:40+00:00"
    }
  ],
  "msg": "Successfully retrieved performance metrics"
}